Understanding your website's traffic sources is key to optimising your marketing efforts. GA4 is a…
How to add a Report in GA4

1.
How to add a Report in GA4
As Google Analytics has officially made the conversion from UA to GA4, many of us are now quickly having to learn the new tools and tricks used in GA4 to give us the same results we found in GA4. The most common questions and frustrations we’ve found asked are to do with the reports section, specifically, how to add a report in GA4.
There are a variety of Google courses out there to help you find your way around GA4. Though, a lot of them brush past how to do simple things like how to add a new report, and instead focus on the complex new reporting features that have been added. So, we’ve put together an easy way of making a new report in GA4 to help you out.
GA4 Explorations

GA4 encourages users to use the explore feature if they want to create a view that isn’t available in the reports section. This explore section is confusing at best to work your way around and you need to have a specific goal in mind before you start to be able to make something that works.
These explorations are also only available in the explore section and you need to click on each individual exploration within this section to view them. Overall, the explore section is great when you have a specific goal in mind, want to view your data in a unique way -such as path exploration- or need to do a deep dive into your data.
But for simpler reports, that are quick and easy to view, contain specific saved data and filters that you commonly use. It’s best I show you how to add a report in GA4.
How to add a new report in GA4

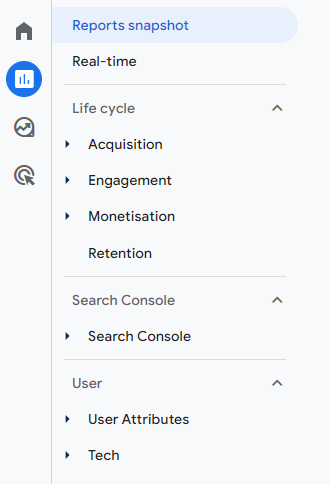
When you first make your GA4 property, you’ll find that there are some report sections already added for you. In this section, you can see the reports snapshot, real-time view, and usually life cycle and user sections.
These beginner sections will tell you pretty much everything you need to know about your website as a rough outlook. Users, user acquisition, engagement rate, geography of users and more.
But what about when you want slightly more information than the classic GA4 interface is giving you? For example, is very common to want to know who exactly your referral partners are quickly, as part of a monthly report. In this case, you don’t want to be adding multiple filters every time you select the “traffic acquisition” report.
In this blog post, I’ll guide you through the process of creating a new report available from the reporting menu.
Creating a new report from a template

The first step is to go to the reports section in the menu bar along the left hand side of your GA4 property.
Then you’ll want to look at the bottom of the reports section to find the “library”.

This will open up your current libraries, where you can see the current collections added to your reports. Near the middle of this page, there is a create new report button, select this.


Then click “create detail report” from this drop down.
This will open a new view, which contains a variety of detail report templates. Like with the explorations, you can either use a template or create one completely from scratch. For this demonstration we’ll use the first option which will use the current “user acquisition” template as a base for us to tweak.

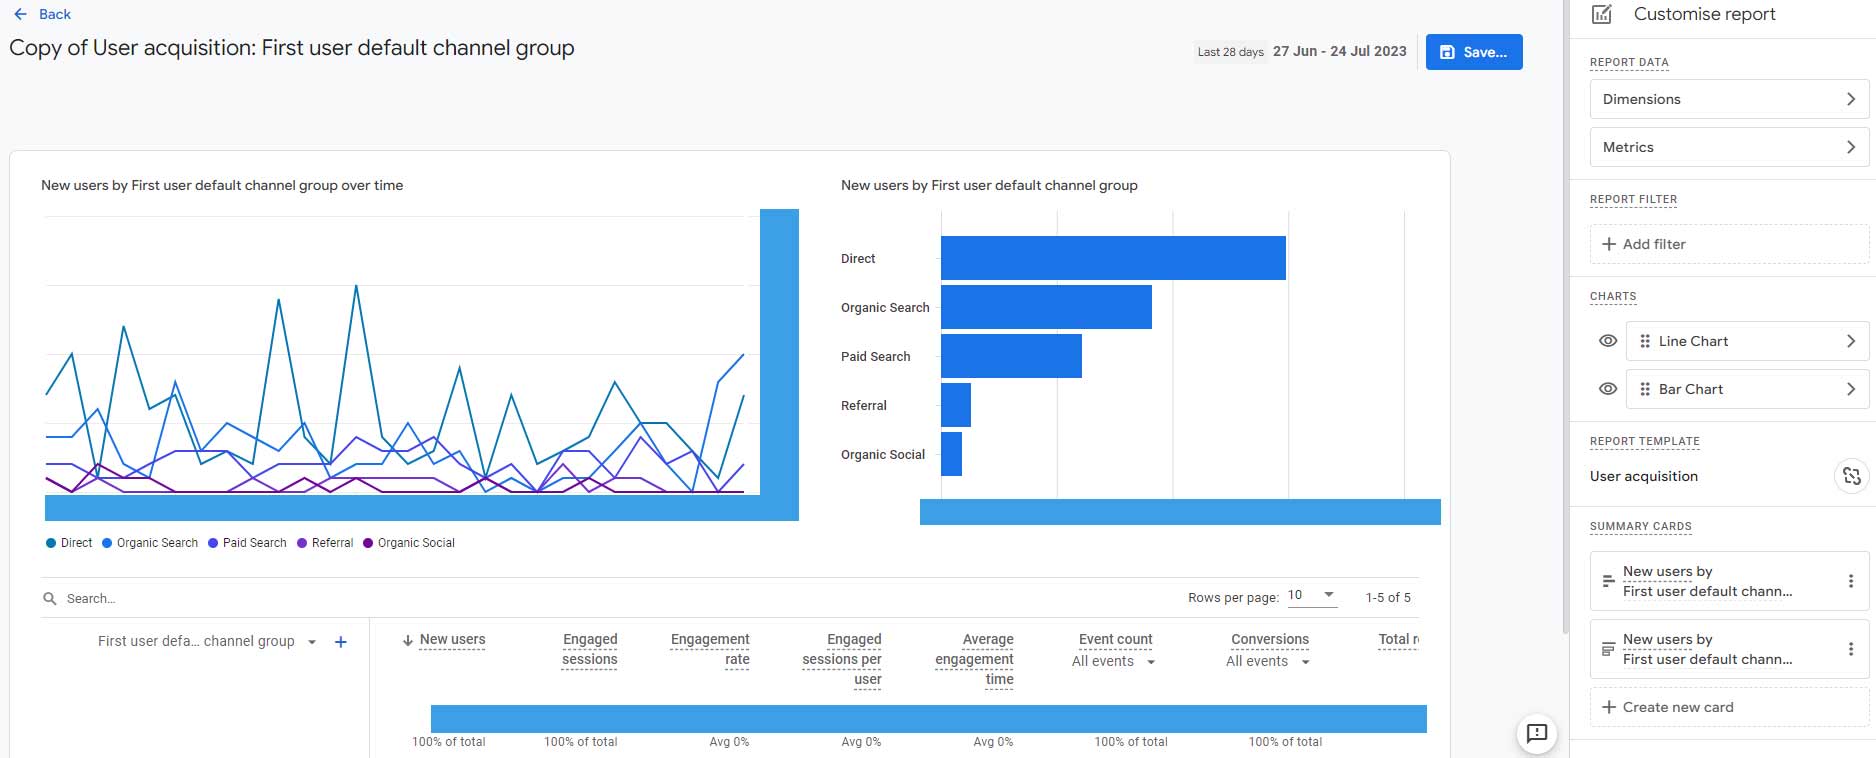
This then opens up onto a page that looks a lot like the user acquisition page, but with some added features. This is demonstrated in the screenshot below, with some information blocked out for privacy reasons.

Along the left hand side, you’ll see some options for the reports dimensions and metrics. These can be edited as you wish, switched around the make the report you desire. For the purpose of this demonstration, we’ll only shuffle some things around to show you how it works. For example, as we’re trying to find the top referral partners, it’s best to put the “first user source/medium” dimension as the default dimension. So push this to the top of the list and click on the three dots down the side and click “set as default”. Then make sure you click “Apply” on the bottom right.


You can then build a filter which will mean that this report will only show up the referral partners we want to see. How you do this, and the options you’ll need to select are outlined in the screenshot below. Once done, make sure you again click “Apply” in the bottom right corner.


Your report is now ready and should look somewhat like the report screenshot below.

Go to the top right of the page and select the save button, naming your report “referral partners” or something similar as you do so. You’ll then need to click the back arrow on the top left as saving this report will not automatically close it.
Adding the new report to your collections
The hard part is done! Now we just need to make it so that this report is easily accessible through the menu. To do this we’ll need to add this report to the collections.
By leaving the report creation page, you’ll return to the library page. Hopefully seeing your new report at the top of the list on the bottom half of the page.

We’ll be adding this report to the “Acquisition” section within “Life cycle” as the report is based off of this data. To do this, you’ll see the box titled “Life cycle” above your new report. On this, click “edit collection”.

On this new view, you’ll ned to scroll down to the bottom of the box on the right, to find your newly made report. Drag this over to the Acquisition section in the box on the left.


Click “save”
The report is now added to your reports menu!

GA4 is new to all of us, and the best way to learn how to use it is practice. I encourage you to try and experiment with new types of reports in GA4.


